 TurtleGit for Mac
Log statistics port
Baseline: TortoiseGit 7338078f8ddd924b8cddee35f512f2286072136d.
The calculation layer and a partial native Statistics window are implemented,
including the Log button, graph choices/styles, original chart button icons,
checkboxes, author slider, lazy Calculate, remembered options and graph export.
Displayed/signed acceptance remains pending.
User instructions: Statistics.
Source behavior
LogDlg.cpp::OnBnClickedStatbutton passes all currently shown revisions, omitting
the working-copy row. It does not independently walk another revision range.
StatGraphDlg.cpp::GatherData sorts that snapshot by the chosen date, groups by
author or committer name and optionally folds case. Defaults are case sensitive,
sort by commit count, author names and commit dates. Empty names become (unknown).
Calculate loads complete commit file changes, regardless of a path filter used to select the Log revisions. Merge revisions contribute commit counts but zero diff measurements. New-file lines and deleted-file lines are kept separately from other added/removed lines; binary statistics contribute file counts and zero line counts. Authorship is the source's weighted commit/file-change measure, not a blame result: from newest to oldest, weight is distance-from-end / 2, except distance zero uses 1; the result is multiplied by file count (or 1 when no files were measured).
The source chooses days for elapsed days below 8, weeks below 15 elapsed weeks, months below 80 weeks, quarters below 320 weeks, and years thereafter. It creates occupied intervals rather than filling calendar gaps. Its displayed denominator is last interval minus first interval, with a minimum of one. Integer averages and this denominator are preserved, including their surprising results for sparse history. Consecutive unit keys use the source month/day, week number, month, quarter or year rules. The source's yearless month/quarter keys can collapse consecutive sparse observations with the same unit in different years.
Current implementation
LogStatistics.swift analyzes a supplied immutable Log snapshot, exposes commit
and file/line measurements per interval and author, rankings, activity min/max,
integer commit averages and normalized authorship percentages. changesCalculated
distinguishes initial lazy statistics from measured totals. An incomplete supplied
measurement cache is rejected instead of presenting missing revisions as zero.
The pure calculation rejects unreadable dates and supports owned cancellation.
GitRepository.logStatisticsChanges reads root/ordinary commit changes through the
existing literal-path diff reader, skips merge diffs and returns a complete cache
only after success. Revision hashes/parents must be actual hash-shaped identifiers;
working-copy pseudo rows are rejected. Progress and cancellation belong to the
caller. Failed or cancelled calculation does not publish a partial cache.
macOS Calendar supplies regional week/time-zone behavior rather than porting the
Windows-specific week calculation (which has a documented DST defect). Equal-date
rows use stable input order; upstream std::sort does not specify tie stability.
Case folding uses Foundation Unicode lowercasing; cross-platform locale casing
acceptance is still pending. These choices need verification with the native UI.
Core fixtures cover names/date/case/ranking options, unknown authors, authorship weights, all unit boundaries, empty/malformed/cancelled input, incomplete caches, actual root/modification/rename/deletion/binary/merge reads, no partial cache after cancellation and exact tracked/index/config/HEAD preservation. No native app or Statistics window is launched by these tests. See the calculation QA record.
Native window and graphs
The Log button owns a separate Statistics window over the current shown-revision
snapshot. Refreshing Log does not change an already open snapshot; closing Log
cancels its calculation and closes the owned window. The selector, central
summary/graph region and lower checkbox/slider/style controls follow IDD_STATGRAPH.
Graph styles use native Swift Charts for bar, stacked bar, line and stacked area
(the upstream stacked-line style is filled), plus Canvas pies. Date pies retain
separate interval groups. Graph data colors use the pinned MyGraph integer HLS palette in both appearances.
The default light background is white and the source dark background is #202020;
controls and text retain native appearance handling. Displayed geometry and full
theme/high-contrast acceptance remain unverified.
The graph projection selects authors by activity before alphabetical presentation,
names the last lone omitted author and sums larger omissions as Others (n).
Authorship ranks by contribution, omits percentages rounded to zero and rounds
each author before summing Others. Date series run oldest first with explicit zero
values. Slider count is bounded at 250 with the source lone-author exception.
Native date labels use regional day formats and week/month/quarter/year units.
Graph titles and axis captions use the pinned resource wording, including
Percents, author (>= 0.5%) and quarter of year. Pie graphs show the x-axis unit
caption below the groups, without Cartesian axes. Author stacked bar now uses one
stack of all included authors/Others, following MyGraph's one original series.
Ordinary bars and lines show the source average guide. MyGraph averages each original series with integer truncation, then averages those results. Date series contain one interval's authors; author graphs have one series containing all individual authors/Others. This can differ from averaging all plotted points. Stacked styles omit the guide. Y-axis range uses the maximum individual value for ordinary styles or maximum interval/author-stack total for stacked styles, with a minimum of one. MyGraph's target-five-ticks 1/2/5 progression supplies integer labels; the native graph no longer uses automatic fractional count ticks or full grid lines. Native font/spacing/axis placement still needs displayed comparison.
Authorship and line metrics calculate diffs automatically; the summary also has
Calculate. The owned event stream updates progress and drains before ending busy
state. Failed/cancelled reads retain no partial cache. Root access is retained and
checked for Store builds. The four preferences and encoded last graph page use the
upstream names, including StatCommiterNames. They save on window close. Original
five graph-button icons are bundled with pinned provenance.
The hidden native receiver checks defaults, actual lazy Git totals, automatic selection calculation, private preference restoration, cancellation and exact repository preservation. It requests layout across all five chart styles; these checks do not prove pixel appearance, displayed clicks or accessibility. See the native Statistics QA record.
Bar geometry and hover text
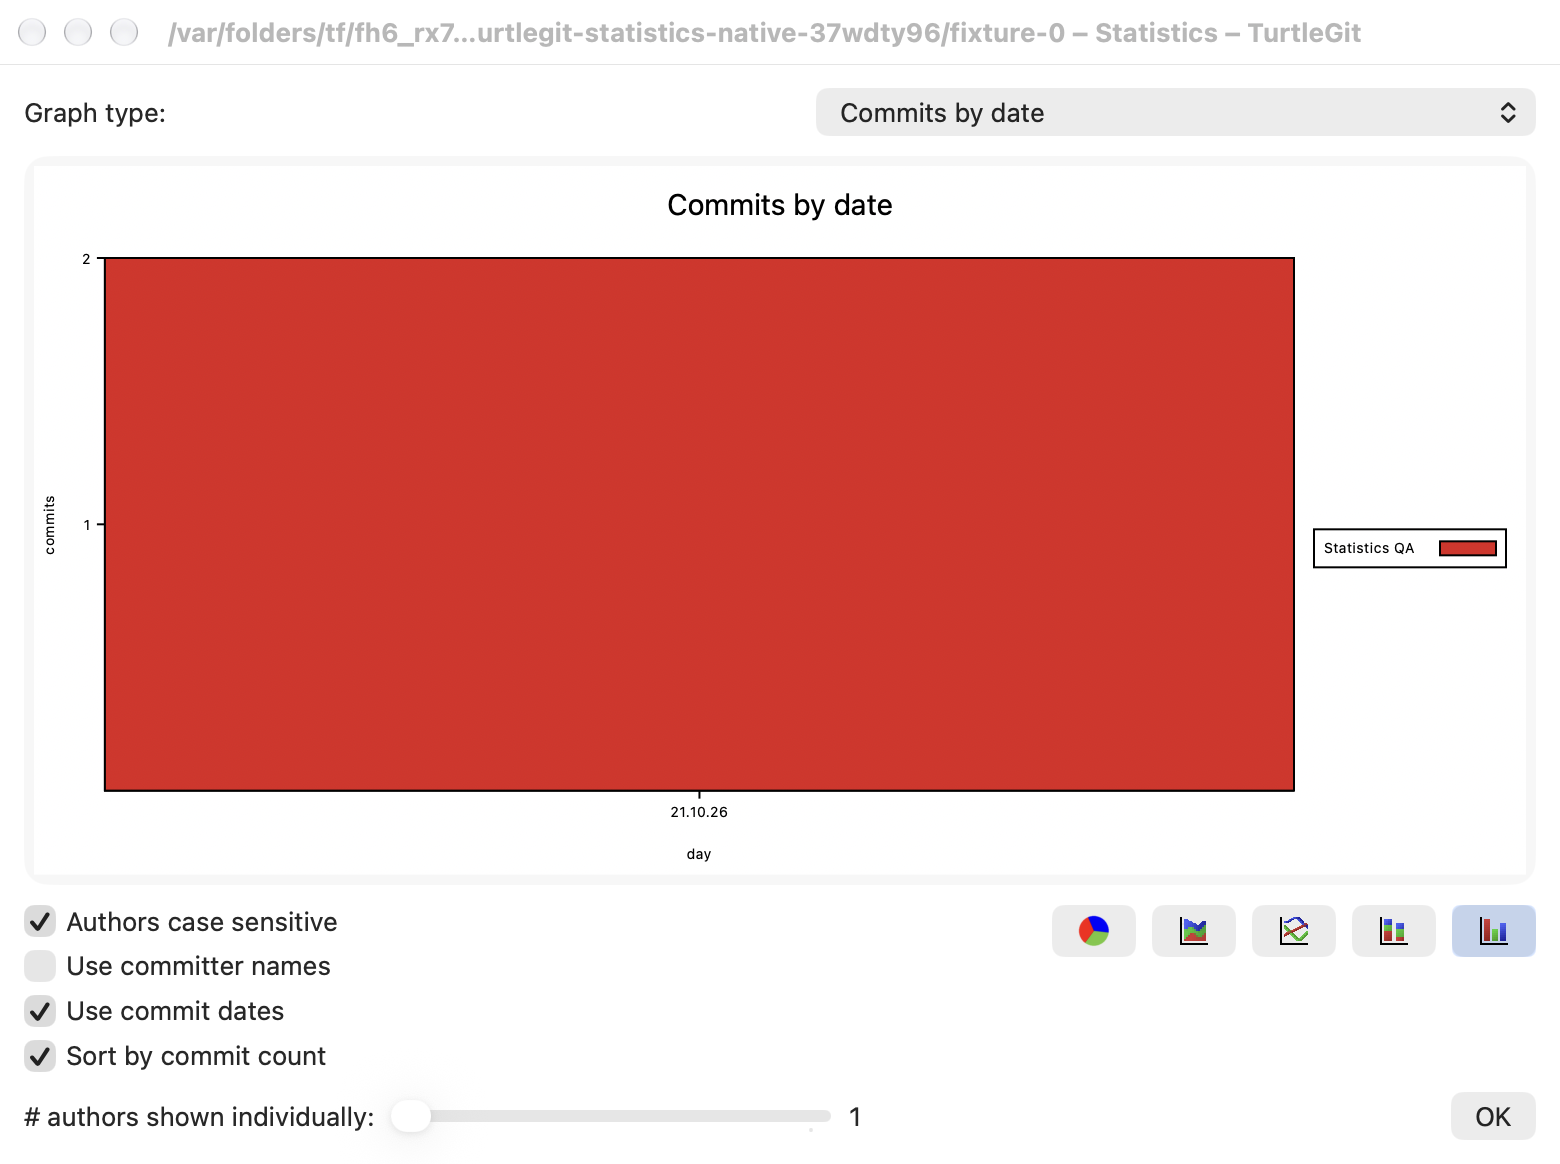
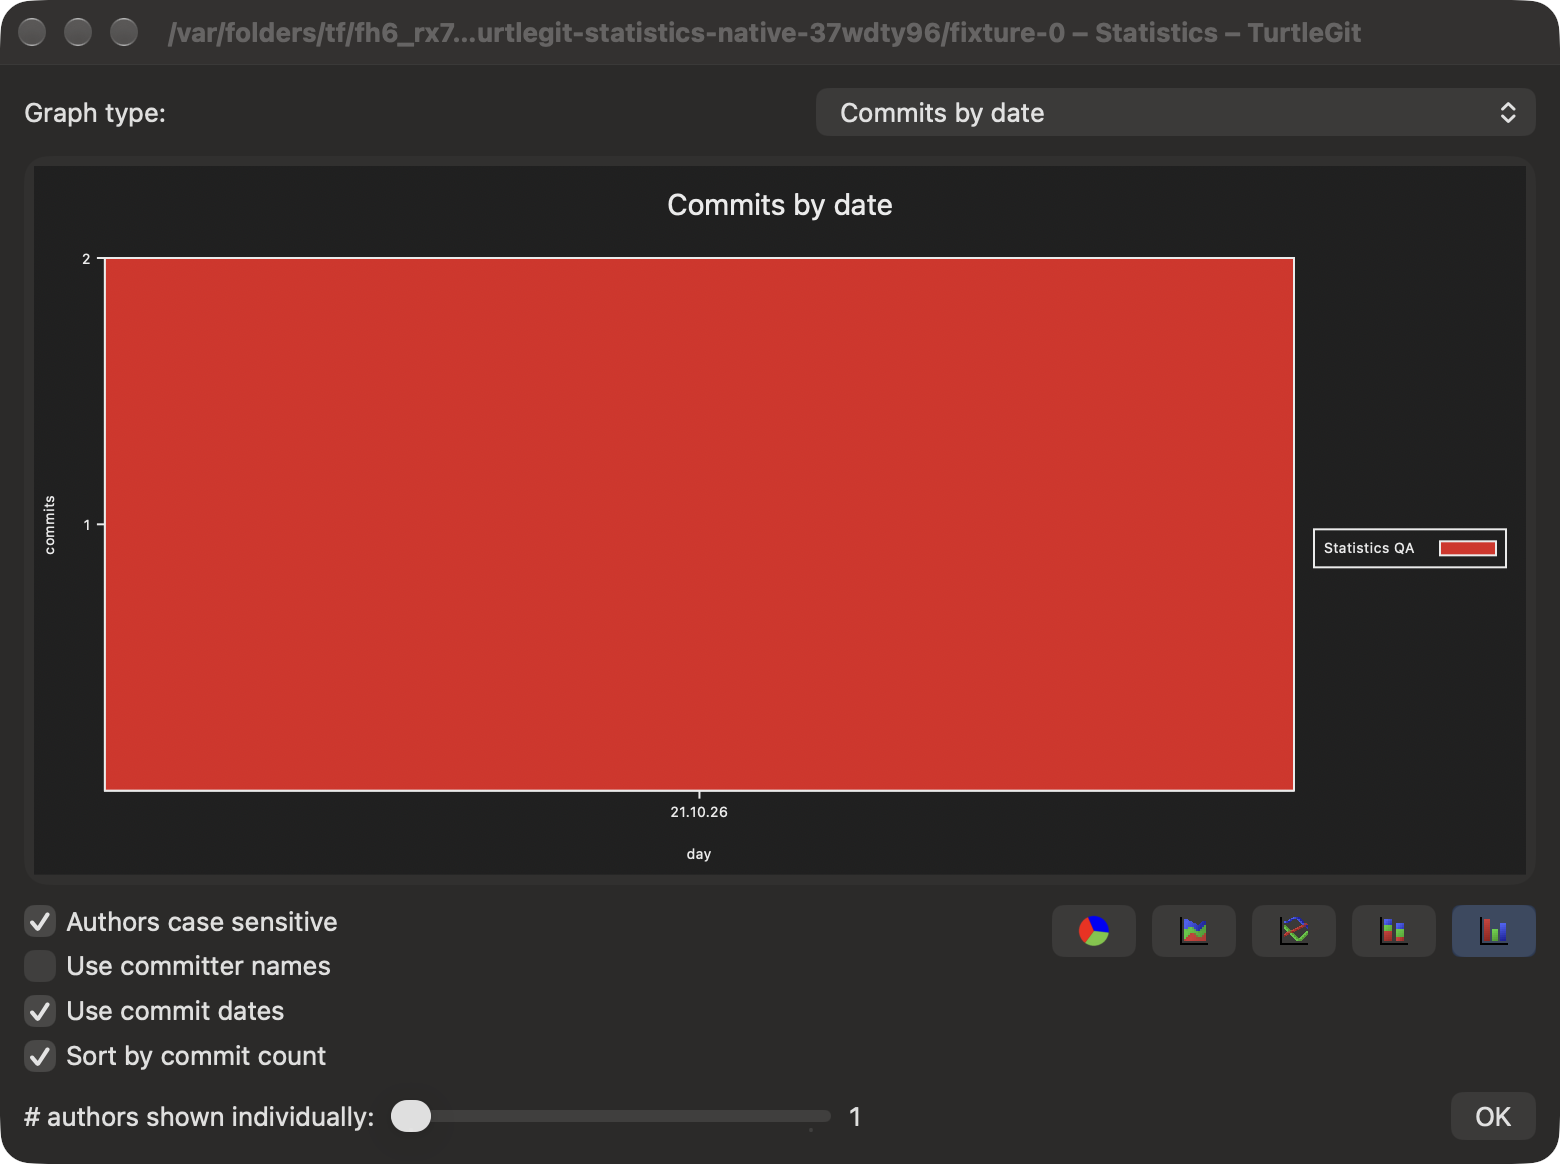
Bar graphs now build source-style populated series. Completely zero-valued intervals and individual zero bars are omitted. Each populated interval gets one slot; ordinary bars share the width based on the largest nonzero group count. Multiple slots use 85% for bars, with the source gap before each slot and the same right alignment. A single ordinary series fills its slot; stacked bars always use 85% and accumulate each group's value. Author graphs use one original series, with an empty series tick caption and authors in the legend. Native rectangles and hover regions share this normalized geometry. Integer bar corners and shared right/bottom borders now drive both painting and hit regions. Exact GDI outlines, font metrics and full legend placement remain pending.
Cartesian native hover uses the plot proxy to find bars or line-point regions; line points use the source six-point bounding box and its below-40-series cutoff. Line marks use a thin stroke and circle symbols. Tooltip text preserves the author, value, y-axis unit and truncated percentage within that original interval (or all displayed authors for author graphs). Average text uses the source maximum as its percentage denominator. Source-style Cartesian average hit priority is retained, including its virtual average region in stacked graphs that draw no guide. Stacked-area polygons have no data hover regions, as in the source.
Pie wedges now progress counterclockwise from the left, following
WedgeEndFromDegrees, and use the same progression to map the native mouse position
to a data tooltip. Each pie stores hover text separately so moving between groups does not clear the
new group's value. Empty/outside regions clear the hover text. Exports omit mouse
tracking overlays. The shared scene now includes the source virtual-average region for pies and the integer endpoint cutoff for tiny wedges. Exact GDI centre/border raster identity and physical hover timing/VoiceOver remain pending. Logical helper tests and compilation do not
prove actual pointer interaction; see interaction QA.
Shared legend and horizontal pies
All five styles now use one boxed legend on the right, vertically centered with
labels followed by bordered color swatches. The automatic Charts legend and
repeated per-pie value lists are removed. The legend offers the source generic
Legend help text. Font fitting uses native system-font metrics and the source
seven-point minimum; crowded legends replace the penultimate visible row with
... and preserve the final group, often Others. A lone omitted group is shown
instead of elided. The legend disappears when the graph's width after its two
ten-point margins is at most 300, following the source visibility threshold.
Native font metrics replace GDI measurements; exact point/pixel sizing, frame
coordinates and very long labels remain subject to displayed acceptance.
Date pies occupy one horizontal row of populated intervals. Zero-valued intervals leave no empty slot. Slots share a size constrained by the available width and height, with pie diameter 85% of the slot and centered as a group. Interval labels sit below the circles, followed by the common x-axis unit; author pies have no series caption. All styles, including pies, export at the current viewport size. Dense history therefore shrinks the pies rather than growing a vertical canvas. The native reserved label/title space is adapted to SwiftUI; exact GDI margins, physical mouse/keyboard acceptance and complete Windows raster identity remain pending.
Core checks cover populated pie categories and legend elision/last-group rules. The native receiver checks actual PDF viewport dimensions and crowded/narrow legend text, plus PNG color-column runs and matching vertical centers for a three-date red/cyan/red pie fixture. These checks verify rendered export layout, not displayed windows or physical interaction. See layout QA.
Graph palette
MyGraph distributes group hue with integer 240 / groupCount, alternates
luminosity 120/180 and derives saturation 180/210/240 from group position. The
integer HLS-to-RGB rounding and WORD hue conversion are preserved. The source's
light-mode darker-line alternative is inside #if 0, so it is not enabled here.
For more than 240 groups, integer hue spacing becomes zero; the resulting repeated
red/pink colors are retained as source behavior. The palette applies to the chosen
individual authors and Others group, so changing the author limit can change the
colors just as it does upstream.
Charts now use an explicit color scale in group order; pie wedges and legends use
the same source RGB values instead of an independent eight-color cycle. The shared
window/export graph uses the default source white/light and #202020/dark
backgrounds. Native text and controls still follow AppKit/SwiftUI appearance.
A standalone reference built from the pinned C++ conversion routines generated the palette vectors. Core tests compare all 756 RGB triplets for nine group counts, including empty, 240, 241 and 251. Native receiver PNG checks verify original palette/background pixels in every style and both appearances, plus both colors in multi-author bar/stack/pie graphs. These pixel checks allow a two-level RGB conversion tolerance. They do not prove full displayed GDI/native geometry, antialiasing, outline/shading, high contrast or accessibility equivalence. See palette QA.
Save Graph As
The File menu enables Save Graph As… only for a ready graph in the key Statistics window, not the text summary or a busy calculation. The native save sheet offers PDF, PNG, JPEG, BMP and GIF with explicit type/extension selection. The original Save As artwork is reused. The selected graph, author limit/style, viewport dimensions and native appearance drive the export. Rendering does not read history again or change Git state; saving writes the chosen destination file.
Upstream OnFileSavestatgraphas defaults the picture filter to .wmf and
SaveGraph writes enhanced Windows metafiles or PNG/JPEG/BMP/GIF. TurtleGit uses
PDF as the macOS vector equivalent, defaulting to .pdf, and retains the four
raster encodings. Its save sheet requires a supported format rather than silently
appending .jpg to an unknown filename. JPEG uses quality 0.9. These are explicit
platform adaptations, not Windows metafile compatibility.
The shared SwiftUI graph is rendered with Apple's ImageRenderer and encoded by Core Graphics/ImageIO. PDF retains searchable labels. Every style uses the graph viewport size at one pixel per point, including the horizontal pie row and shared right-hand legend. Canvases over 16,384 points on an axis or 32 million pixels are rejected with an error before bitmap allocation. Writes are atomic, hold the save-panel URL's available security scope and report encoding/write failures to the window. A cancelled sheet does not write.
The hidden receiver decodes each format across all five styles and both appearances, checks searchable PDF labels and colored raster content, complete multi-author/date-group PDFs, summary/busy refusal, accessory format/extension selection and failed writes. This does not prove displayed save-sheet interactions, overwrite confirmation, focus routing or signed sandbox acceptance. See the export QA record.
Source labels/average/stack/tick verification: graph presentation QA.
Remaining work
- Displayed File-menu/save-sheet/overwrite/cancel and signed export acceptance.
- Displayed axis/title/average-guide geometry, tooltips/selection, high-density legends/graphs and exact outline/shading/font/geometry comparison, plus sparse-date/year-wrap acceptance.
- Displayed layout, regional/DST/case acceptance, keyboard/VoiceOver and signed sandbox/App Store verification. The full application port remains incomplete.
Connected graph workflow ownership — October 14, 2026
Statistics now keeps its owned Git calculation, repository grant and application Quit protection until the worker finishes. Cancel retains the previous complete summary without a partial changes cache. A requested window close cancels and closes automatically after settlement; forced closure retires progress, results and errors while retaining operation accounting. A cancelled changes graph offers Calculate again without requiring a new window. Log supplies its own preference store to its Statistics child.
The summary hides Sort by commit count, author-limit slider and graph-style buttons, following StatGraphDlg::ShowLabels. The graph keeps original style icons and identifies the selected style. Busy/sheet/retired owners reject changes through native bindings. A saved author graph with an incompatible line style falls back to Bar; this native repair prevents restoring a style disabled for author graphs. Source metric-change defaults and the encoded preference keys are retained.
Statistics and Revision Graph now retain their Save panels and error sheets under their owning windows. Cancel releases the sheet and permits another export. Forced closure dismisses owned children and refuses delayed replies. Export writes hold the destination's available security scope and remain atomic. Revision Graph now reports export failures in an owned native error sheet. Its panel blocks zoom/filter/Find/reload until it settles; stale graph generations cannot write. Existing vector/raster formats, palette and rendering remain unchanged.
The Debug build and four grouped native cases passed with system and bundled Git. An initial fixture compilation error was corrected before any receiver launched; no app build or Core check was repeated. All four owned receivers were reaped. See batch evidence. Injected panel replies do not prove physical save/overwrite input, signed destination grants, keyboard or VoiceOver acceptance. Full visual/source/App Store certification remains open.
Source form and captured graph export — October 17, 2026
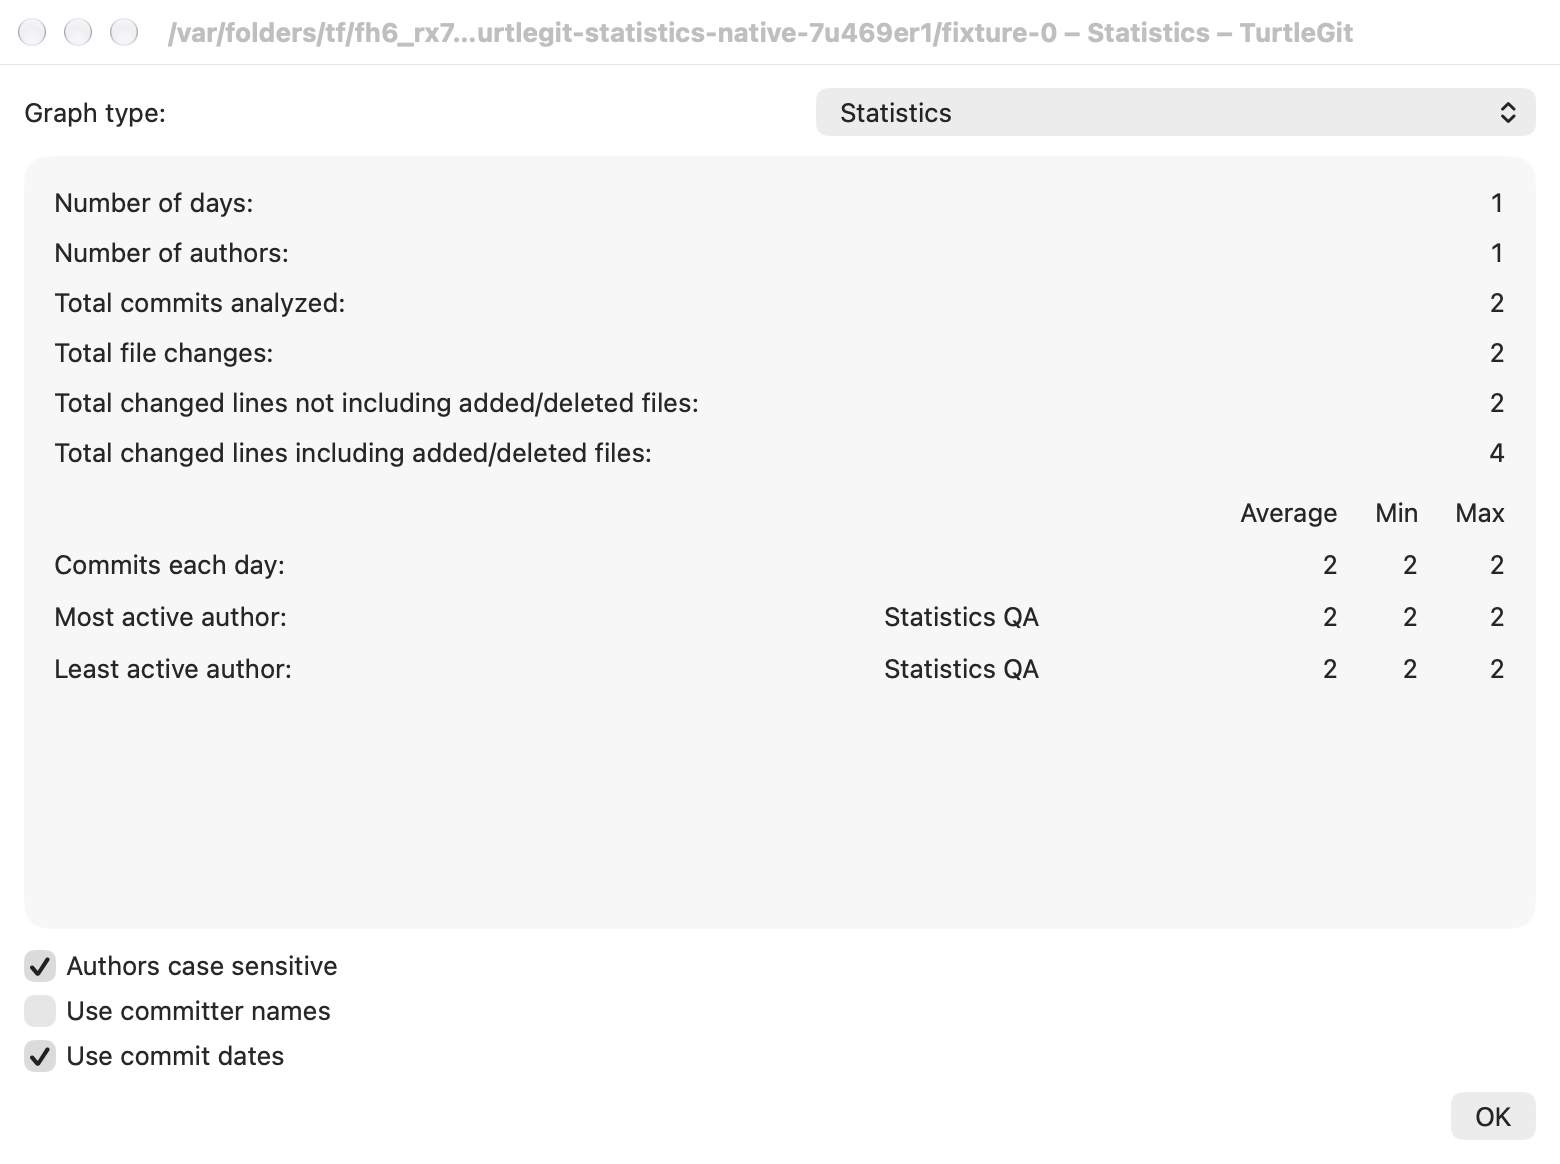
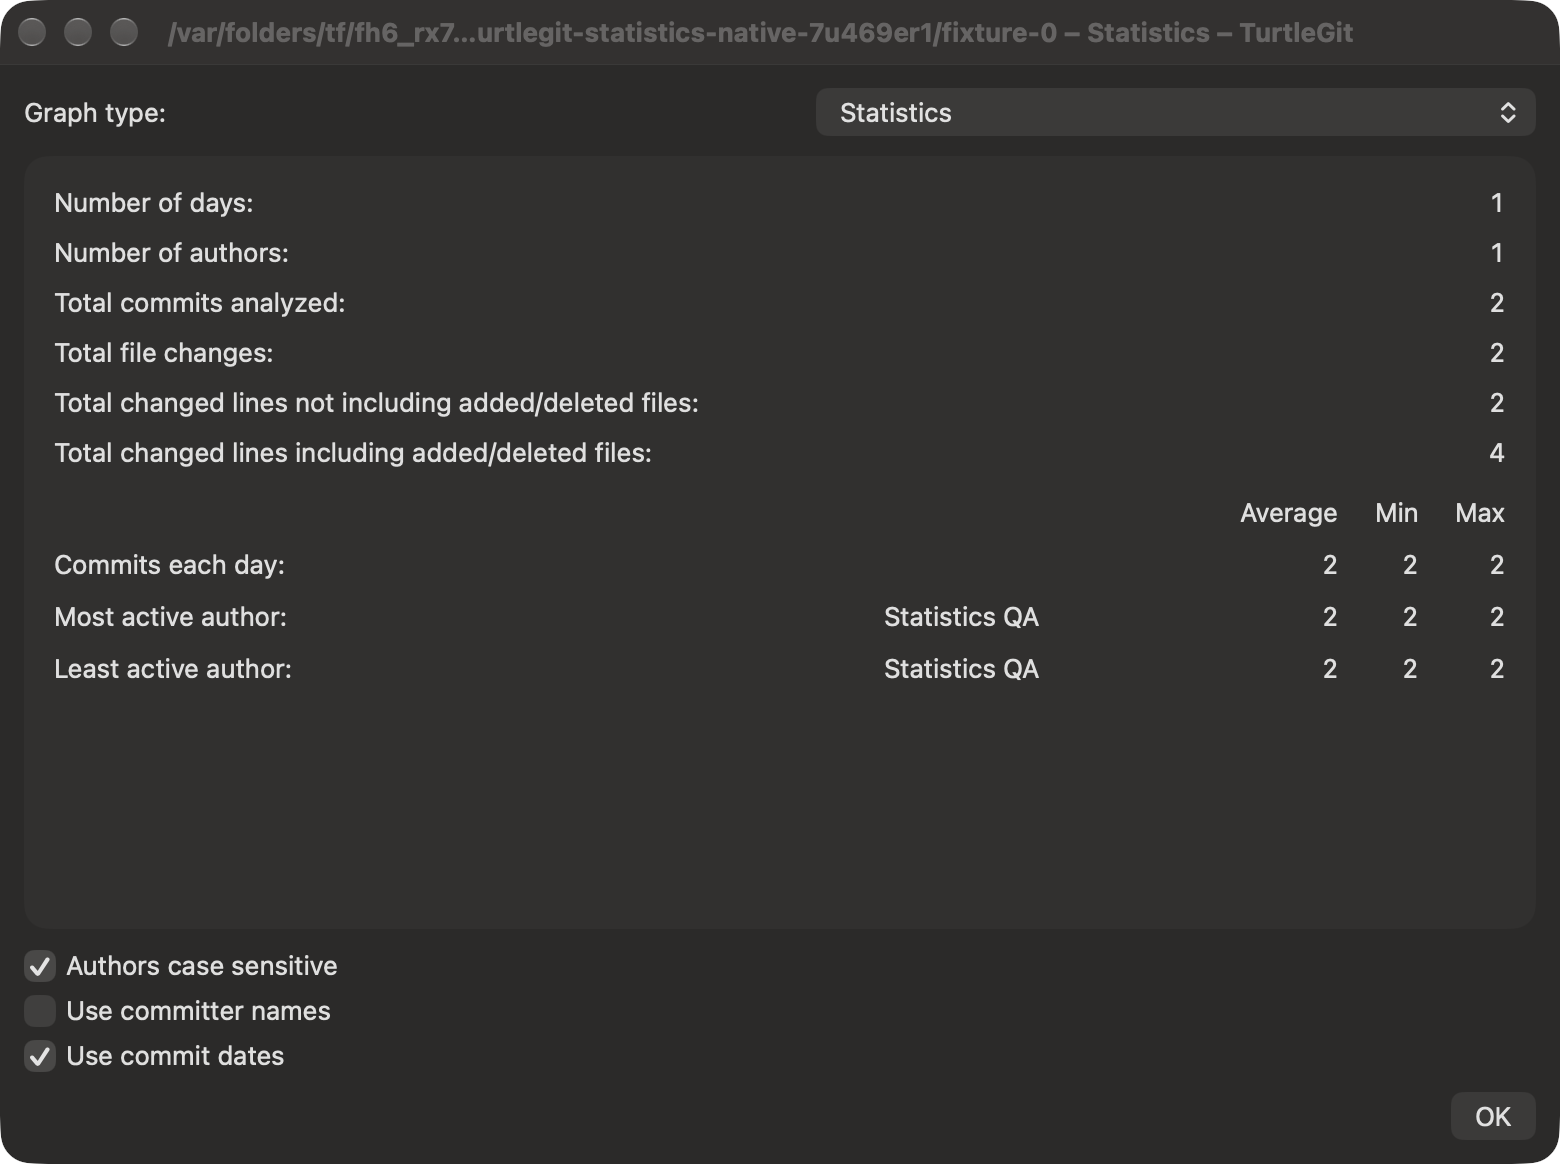
The Statistics summary now follows the source's full-width label/value rows, followed by the Average/Min/Max activity grid. Empty snapshots retain blank author names and zero activity rows. Window content constraints retain the summary and source-order footer at the minimum size. The five original style icons have explicit selection feedback and accessibility values; author-only graphs refuse line styles. Native slider help/accessibility uses OnNeedText's commit threshold, integer percentage, raw slider position and lone-omitted-author exception. Its ranking is shared with graph projection, including contribution-ranked authorship. Nonfinite and oversized slider input is refused or bounded before integer conversion.
Metric/style/options/slider callbacks capture their form revision; a callback from an earlier presentation cannot change the new graph. File menu actions retain the Statistics owner and form revision. Save Graph captures graph, metric, style, viewport and appearance before opening the file panel. The picker accepts once and rejects old/cancelled/closed/replaced-form replies. Rendering uses the captured snapshot; accepted atomic writing happens off the main actor with its destination scope. Controls and ordinary close wait for completion. A forced close retires UI and dismisses sheets while accepted writing retains independent Quit accounting; late failures cannot reopen the closed owner. Save errors belong to that window.
The Debug build and all sixteen focused Core checks pass. The grouped native family passes with system and bundled Git, including all five actual export encodings/styles in both appearances, existing calculation/cancellation paths, owned Save panel Cancel, captured export size, old/duplicate callbacks and accepted write/close/Quit lifetime. The first build needed explicit self capture repair; no Core checks were repeated for native-only repairs. An initial native attempt correctly refused a stale menu object before launching a receiver. Raw review then found the activity grid too far left; only its layout build/capture case was repeated. Final light/dark summary and bar captures were individually reviewed. All three owned receivers were reaped and independently absent. See batch evidence.
Physical keyboard/VoiceOver, exact Windows/macOS typography, large-repository performance and signed AppStore/Finder acceptance remain open. It does not certify the whole Statistics dialog or the complete application.
Exact author identity throughout Statistics — October 20, 2026
The pinned source converts CString author names to std::wstring keys in GatherData, LoadListOfAuthors and graph construction. Swift String equality previously merged canonically equivalent spellings in author dictionaries, even with Authors case sensitive enabled. Changing only the calculation keys would still leave another merge in Swift Charts: its foreground grouping and color domain used the displayed name, also collapsing a real author whose caption matched synthetic Others.
LogStatisticsAuthor retains each decoded name's exact UTF-8 spelling as its
identity, with UTF-16 ordering for source-style ordinal name comparisons. Author
and committer grouping, per-interval counts and measured changes, activity and
authorship rankings, slider cutoffs and omitted-author membership use that typed
identity. Explicit Foundation lowercasing remains optional and does not request canonical
normalization. This does not add recovery of malformed original Git identity
bytes after they have already been decoded into the Log model. Cross-platform
locale lowercasing acceptance remains open.
The native summary uses typed author identities for activity lookup and projects
only .name for display. Cartesian marks group by stable graph category/series
positions, with the same explicit index-to-color scale. Pies, hover hit regions
and the shared legend already use positions. Chart accessibility and tooltips
retain the original names rather than internal grouping keys. Save Graph As uses
the same chart over its captured graph snapshot, so export cannot regroup authors
by their visible caption. Original display spelling, source palette, author
limits, existing capture/cancellation and owned-save behavior remain in effect.
The author-identity evidence records the actual grouped validation and repairs for these distinct-name and synthetic-caption cases. Earlier Statistics evidence does not certify them. Physical pointer/VoiceOver, exact Windows typography, regional casing, signed export and full dialog acceptance remain separate open work.
Save filters, calculation capture and retirement — October 21, 2026
The save and calculation continuation restores the source Pictures/All Files filter contract with filename-selected output, explicit PDF vector adaptation and final URL confirmation. It adds cancellation-aware atomic export, owned sheet/worker drainage, captured calculation backend and Log cache replacement. Its dated evidence supersedes the earlier accepted-save forced-close rule for current interactive exports; historical outcomes above remain evidence for their recorded versions. Remaining physical, signed, full source-layout and hosted acceptance stay explicit.
Shared scene and native interaction ownership — October 23, 2026
The native chart and its exported scene share the pinned MyGraph.cpp hit
geometry. Tooltip priority is the whole Legend box, the Title region, the virtual
average band, then matching groups in the first original series. Overlapping
intervals no longer combine unrelated series. The virtual average band exists for
all five styles, including pies and stacked styles that draw no guide. Ordinary
line hits use a six-by-six rectangle around each point, including zero values,
and disappear at forty original series; stacked areas retain no data regions.
Bar paint and hover use the same integer corners and shared border pixels. Pie centers, radii and endpoint cutoffs follow the source; skipped tiny wedges do not advance the last painted endpoint. A single full-circle wedge uses a native closed circle. Native font measurements remain the macOS adaptation rather than a claim of Windows Arial/GDI pixel identity.
Each chart projection captures its owning form revision and checks current Statistics interaction eligibility when a tooltip callback arrives. Save/error sheets, calculations, export, Quit confirmation and retired windows block stale callbacks immediately. Tooltip tag, projection generation and size receipts reject callbacks from replaced or resized geometry. Dismantling releases the owner closure, tooltip regions, drawing and accessibility children. Data values remain available as accessibility labels even where source hover regions are absent.
The dated grouped checkpoint records scene and actual controller ownership coverage, failures and repairs. Physical hover timing, keyboard/VoiceOver sessions, complete source layout, installed signed execution and full hosted integration remain separate gates.